Transport procurement is a complex matter, if you want to do it right! There are many pitfalls, and this blog tells you how easily logistic buyers shoot themselves in the foot by their decision to use a prescribed freight table template. Unfortunately, in transport freight tables often lack transparency due to their enormous sizes. Load meters and cubic meters are transferred to kilograms with different conversion factors per providers. Weight brackets and zip code zones also differ per service provider 99% of the cases. In order to properly procure and with that translate rates to costs, buyers will need to match the complex tables with a representative shipping profile.
You will receive a different table for each dispatch/country combination. In a simple Tender/RFP you will easily get tens to hundreds of different tables to compare. Not to mention various (fuel) surcharges that also impact the rates shown in the tables. Even for the most Excel experienced business analyst, performing a correct and complete analysis not possible (or at least extremely time consuming and laborious) without proper tooling.
The “solution” many buyers revert to for this complex problem (and so do most of the online tender platforms/tools) is to create a fixed rate template! This will reduce part of the complexity because the tables received from service providers will be similar and much easier to compare. I will explain why I like to call this “The Killing Template”. Yes, this template will save the buyer much time and/or will actually allow them to make a comparison at all. But in the end, this can easily lead to double digit percentages of increase in yearly transportation spend. We will illustrate this with an simple but representative example:
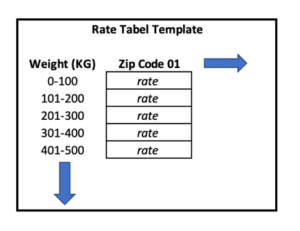
In this example our buyer prescribes rate table template that is visible below, and requests a quotation from two different service providers, in this template. Let’s assume we focus on 40 shipments up to a (calculated) weight of 500 kg. For simplicity the table only has one zip code (zone), weights are up to 500kg, and no surcharges are applicable. As said, normally these tables are much larger and more complex.
The buyer receives the following two offers from the service providers, which are considered their “best and final offer”.
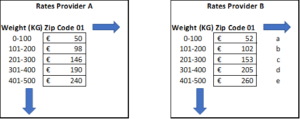
Now the buyer faces the challenge to translate these prices to actual cost (spend) for a decision making comparison on price. This is done by looking up the rates for the 40 shipments In the rate tables, taking into account their frequency (8 shipment in each bracket for simplicity) and sum up the total cost.
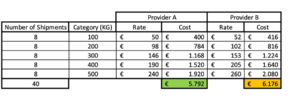
The analysis above shows clearly that based on price only (not taking into account in quality aspects or lead times), service provider A with a total cost of € 5.792 has the best offer for the buyer’s shipment profile. Servicing the same shipments with service provider B is € 384 more expensive (about 6%). Subsequently the buyer presents these nice figures to management and they decide to go for provider A (assuming the offered quality is the same). “Mission accomplished” for the buyer who is happy that the difficult tendering project is from his agenda for the next coming year(s).

But what if the buyer would have had access to the right tooling, and there would have been no need to prescribe a template? In practice we see a large variety of scales being offered, or alternatives like a rate per KG or rate per 100 kg. Let’s assume that in our example service provider A usually offers in the exact same format (weight brackets), but service provider B has its own format with a more detailed graduated scale in his weight brackets. With the opportunity to quote in their own format, the offer from service provider A remains the same, while the offer of service provider B changes as depicted below:
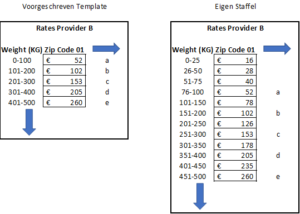
When comparing the initial offer received from service provider B with their new offer, we see the exact same weight categories, and prices. In our experience, service providers spend significant time in changing their own format into the prescribed format, often with some in mistakes. Now, if we redo the analysis on the two quotations, it becomes instantly clear why tendering with a prescribed table is “killing”!
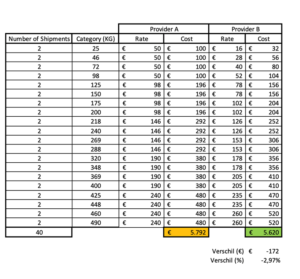
Since the table of service provider A did not change, this naturally results in exactly the same calculated cost (€ 5.792). The cost calculated for service provider B however, changed to € 5.620 due to their more detailed format. Suddenly, Service Provider B turns out to be actually 3% cheaper compared to service provider A instead of 6% more expensive.
This simple example demonstrates how the use of a prescribed rate template is “killing”! Provider B’s initial offer (in the prescribed template) turned out almost 10% more costly compared to the offer in their own format. This results in sub-optimal analysis and wrong decision making by the buyer/management. Prescribing a template for quotation prevents service providers from accurately highlight their company strengths.
This is not just a theoretical story. In every project where we support our customers, we see the differences in offers in terms of types and/or scales. In this example we only highlighted weight zones, but also zip code zones are sometimes prescribed, in which case you may filter out the regional advantages of locally strong service providers.
In conclusion: requesting freight rates in “fixed templates” will often lead to percentages higher freight spend, and therefore is “killing”! Additionally, this approach causes an unnecessary amount of effort for service providers to adapt their quotations, and is prone to errors.
Ultimately: for a nice haircut you go to the barber and for bookkeeping you also use a specialist. Reason? These experts do this all the time, with a lot of experience and the right tooling, so that they deliver better results and faster than you can do it yourself. For procurement of transport the same applies. Hiring an expert with the right analytical software, or acquiring such software yourself. This will have a quick return on investment in terms of the time you save, and better informed decisions on selecting the right service providers for your shipment, who have the full freedom to offer you their strengths.
There are many more pitfalls, feel free check out our other blogs or reach out!